
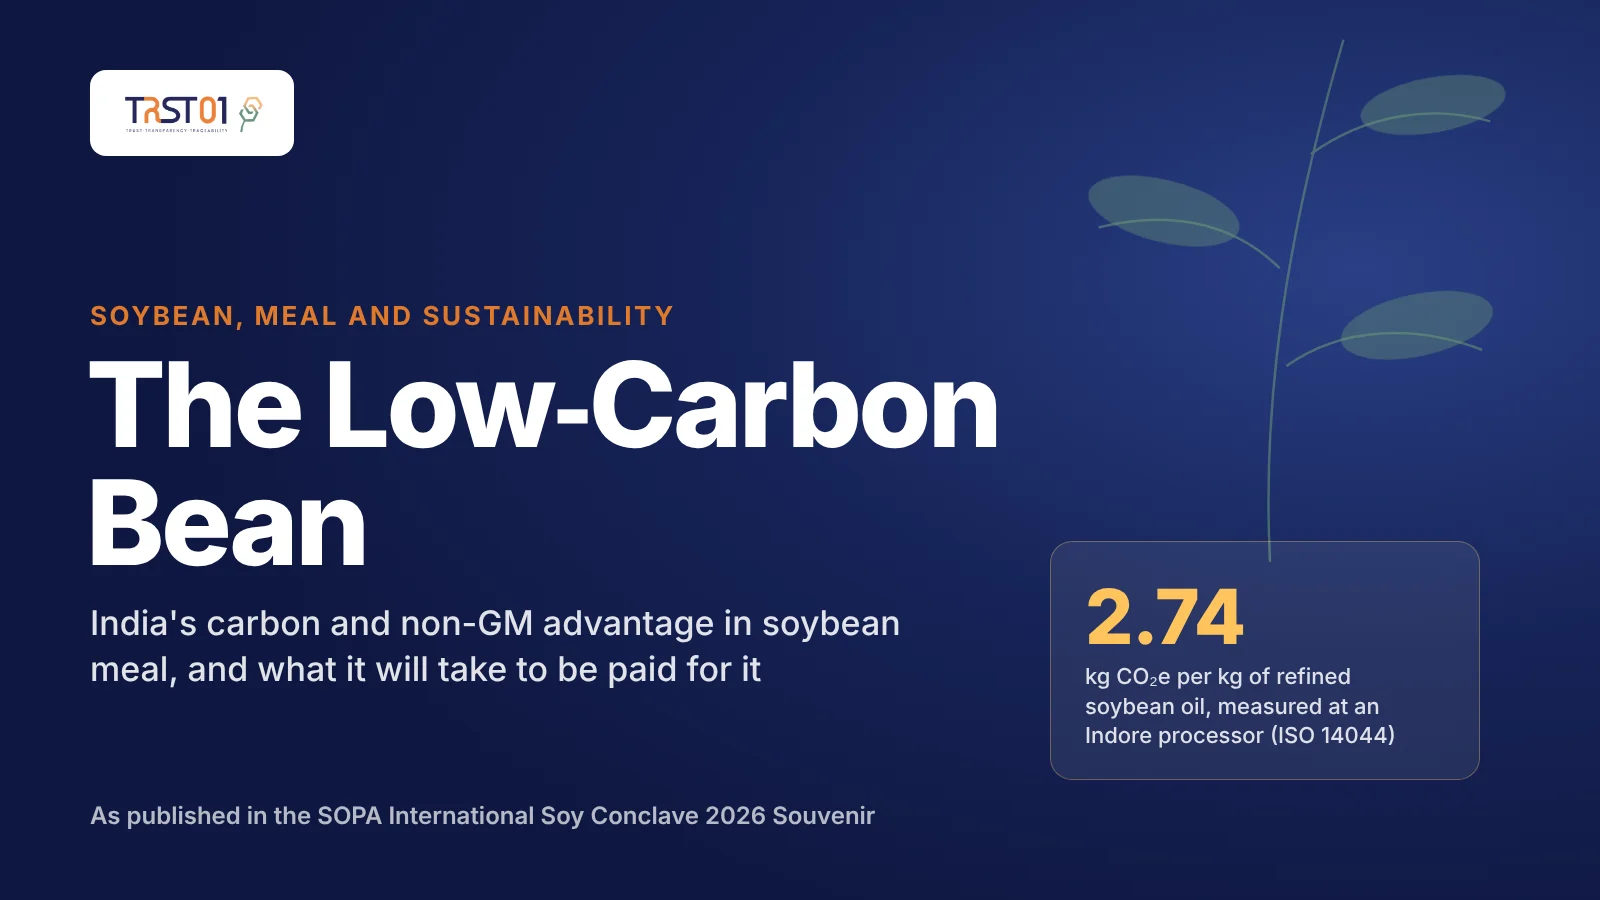
The Low-Carbon Bean
By Prabir Mishra, Founder & CEO, TRST01 · First published in the Souvenir of the SOPA International Soy Conclave 2026 (16–17 October 2026, Indore), Soybean Processors Association of India · Download the article as printed (PDF)
India's carbon and non-GM advantage in soybean meal, and what it will take to be paid for it
Indian soybean has spent forty years being sold as a commodity and losing, on freight and on scale, to origins that will always beat it on both. From December, the market that matters most begins buying something India happens to have and Latin America increasingly does not: land with no clearing behind it, a bean with no genetic modification in it, and a carbon number well below the global default. Until recently that advantage was an assertion. An independent ISO-conformant assessment of an Indore-based processor now puts a measured figure against it, and the figure is better than the industry has been assuming.
1. A market is being built around provenance
The EU Deforestation Regulation applies to large and medium operators from 30 December 2026 and to smaller operators from 30 June 2027. Soy is in scope, meal included. Compliance requires evidence that the commodity did not come from land deforested after 31 December 2020, that production was legal in the country of origin, and geolocation traceable to the production plot: a single co-ordinate for plots of four hectares or less, a polygon for anything larger.[1]
Two further developments have made verified origin considerably scarcer than it was a year ago. In April 2026 the European Commission reclassified soybean as a high indirect land-use change risk feedstock, phasing soy biofuels to a zero share of member states' renewable energy targets by 2030. It is the second oil crop after palm to be so designated. And the Amazon Soy Moratorium, the industry's own voluntary mechanism and credited with preventing roughly 3.2 million hectares of clearing, has effectively ended: ordered suspended by Brazil's competition authority from 1 January 2026, abandoned on 6 January by the major traders who together handle around 45% of Brazil's soy shipments, and left commercially dead in August when the Supreme Court upheld the state laws stripping tax benefits from participants even while affirming the pact was lawful.[2]
The consequence for the world market is a split into two tiers. The best published modelling of EUDR's trade effect finds that non-compliant volumes divert rather than disappear, absorbed by price-sensitive Asian buyers at a discount while European prices rise sharply. USDA already has EU soybean meal imports falling from 20.61 million tonnes in 2024-25 to 19.50 million in 2026-27. Somebody will supply the tier that Europe still buys, and it will be whoever can document where the crop grew.[3]
2. What India already has
The carbon footprint of soybean is overwhelmingly a land-use story, which means it is overwhelmingly an origin story. Cultivation emissions (diesel, fertiliser, crop protection) are broadly similar wherever soybean is grown. What differs, by an order of magnitude, is whether the field was forest twenty years ago.
On the most widely cited regional series, Latin American soybeans carry about 4.8 tonnes of CO₂e per tonne of beans, roughly 90% of it land-use change. North America sits at about 0.4. India falls within a regional average of about 1.0, a quarter of the Latin American figure, and for the same reason the North American number is low: the crop is grown on land that was already farmland long before the current rotation.[4]
Soybean carbon footprint by region of origin (t CO₂e per t soybeans):[5]
- Latin America: 4.8 (about 90% from land-use change)
- Africa: 2.6
- Asia & Oceania (incl. India): 1.0
- Europe: 0.7
- North America: 0.4
To that, add two attributes India has by default and cannot easily lose. Genetically modified soybean is not approved for cultivation in India, so the entire crop is non-GM without a segregation cost, a position European, Japanese and Korean feed buyers pay for and which South American origins can only reach through expensive identity preservation. And Indian soybean is smallholder-grown on long-established cropland in Madhya Pradesh and Maharashtra, which between them account for around 86% of output. There is no clearing frontier behind the crop to explain away.
Put plainly: the four things the December market will ask for (deforestation-free, legally produced, traceable and low-carbon) are three-quarters satisfied by Indian soybean before anyone does anything. Only the fourth, traceability, requires work.
3. The carbon arithmetic a crusher should know
Three technical points decide whether that advantage converts into price, and members will meet all three in negotiation.
Allocation sets the number. A crushed bean is roughly 20% oil and 80% meal by mass, and how the crop's emissions divide between the two moves the oil's footprint by nearly a factor of two: 20% of the burden on mass allocation, 33% on energy content, 41% on economic value. Three defensible carbon figures therefore exist for the same tank of oil, and the applicable one is chosen by the buyer's regulator, not the seller. Fix the allocation basis before the price in any carbon-linked contract.
Jurisdiction sets the penalty. Under the EU Renewable Energy Directive soybean biodiesel carries a default intensity of 47.0 gCO₂e/MJ, but the Directive assigns oil crops as a group an indirect land-use change factor of 55 gCO₂e/MJ on top. Add it and soy reaches 102 against a fossil comparator of 94. California assigns soybean oil 29.1. The United States, since January 2026, assigns nothing at all. The same bean, three regulators, three answers, and the European penalty is applied to the crop as a group, regardless of where it grew. That is precisely the injustice a verified Indian origin figure would exist to correct.[6]
And the crop-level comparison will be used against you. On a like-for-like basis, median soybean oil at 4.25 kg CO₂e per kg of refined oil sits above palm at 3.73, sunflower at 2.94 and rapeseed at 2.49, and oil palm yields about seven times more oil per hectare. There is no point disputing the median. The answer is the variance: palm's land-use emissions run 0.87-1.81 kg CO₂e per kg on mineral soils and 22.75-28.81 on drained peat, a spread of fifteen to thirty times within a single crop. Origin and system, not species, decide the number. Every time that argument is made, it is made in favour of Indian soy.[7]
Carbon footprint and land efficiency by oil (kg CO₂e per kg refined oil; tonnes of oil per hectare):[8]
- Soybean: 4.25; 0.44 t/ha
- Palm (all systems): 3.73; 3.04 t/ha
- Sunflower: 2.94; 0.76 t/ha
- Rapeseed: 2.49; 0.73 t/ha
- Palm, land-use component only: 0.87 to 1.81 on mineral soil; 22.75 to 28.81 on peat soil
4. An independent study puts a number on it
Until recently the Indian claim rested on regional proxies. It no longer has to. An independent product carbon footprint study by TRST01, conducted for a soybean processing company operating out of Indore, has measured the cradle-to-gate footprint of packaged refined soybean oil under ISO 14044:2006, with a declared unit of one metric tonne of packaged product.[9]
The assessed global warming impact is 2,740.52 kg CO₂e per tonne of packaged refined soybean oil, or 2.74 kg CO₂e per kg. Reported water consumption is 153.08 m³ per tonne.
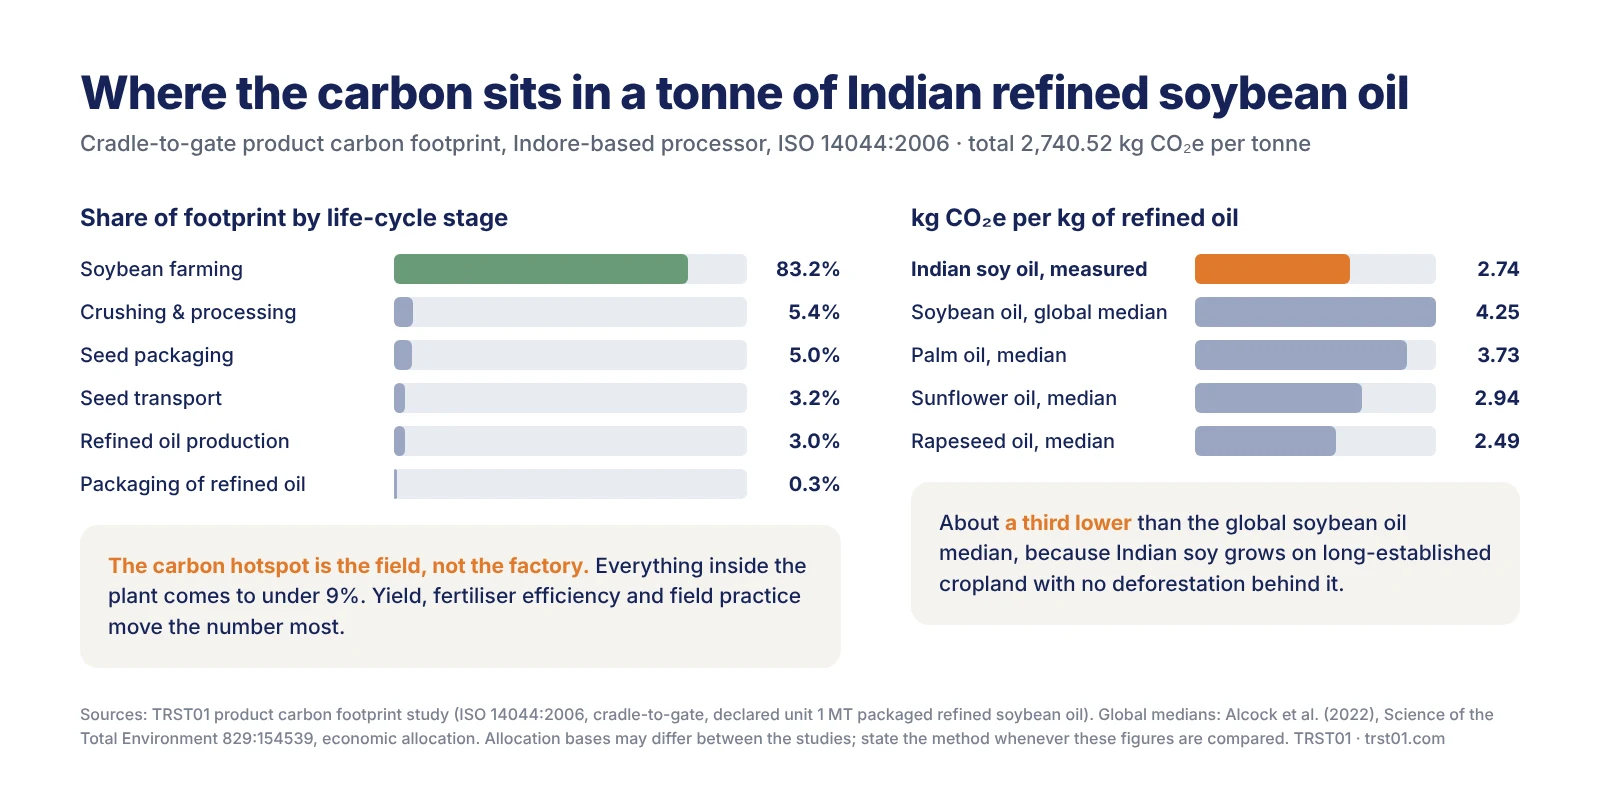
Product carbon footprint of packaged refined soybean oil, by life-cycle stage (kg CO₂e per MT of oil):[10]
- Soybean agricultural production: 2,281.04 (83.2%)
- Soybean crushing & processing: 147.11 (5.4%)
- Soybean seed packaging: 135.72 (5.0%)
- Soybean seed transport: 86.57 (3.2%)
- Refined soybean oil production: 81.02 (3.0%)
- Packaging of refined oil: 9.07 (0.3%)
- Total: 2,740.52 (100%)
Two findings matter commercially. The first is the total. Against the harmonised international literature, which puts median soybean oil at 4.25 kg CO₂e per kg, a measured Indian figure of 2.74 sits roughly a third lower, and below the 3.73 median for palm. That is the quantified version of the origin argument in Section 2: an Indian bean grown on established cropland does not carry the land-conversion burden that sets the global soy default.[11]
The second finding is where the carbon sits. Agricultural production accounts for 83% of the total; everything inside the plant (crushing, extraction, refining and packaging combined) comes to under 9%. The carbon hotspot is not in the factory. A processor that halved its plant energy use would move the product footprint by roughly three percent; the same effort directed at field practice, fertiliser efficiency and yield would move it by an order of magnitude more. That finding reframes decarbonisation for this industry as a procurement and extension problem rather than an engineering one.
What comes next: turning a number into a price
Measurement is the first half. The commercial template already exists, and it is close enough to India's position to be worth copying. A Ukrainian crusher had the footprint of its certified non-GM soybean meal measured by an Austrian research institute on primary data collected across a full season, and published the result: 0.36 kg CO₂ per kg of meal against 1.99 kg for average soybean meal on the European market, an 80% reduction driven almost entirely by the absence of deforestation and land conversion in its supply chain. It then sold that number.[12]
What the Indore study demonstrates is that this is now within reach for Indian processors: the exercise is a season of primary data collection and an independent assessor's fee. What it does not yet do is settle the question for the sector. One company's footprint, however well conducted, is not an origin claim. India still lacks a published, methodologically harmonised soybean assessment broad enough for a European buyer to apply to Indian meal generally, which means most negotiations still default to the global soy figure set by Latin American land conversion. The sector continues to pay a carbon penalty earned by somebody else's deforestation, but it now has a first data point with which to argue.
5. Why the premium is not being captured
The obstacle is not the crop. It is documentation, and it has three parts.
Traceability is an aggregation problem. Proving plot-level provenance across millions of small holdings requires digital procurement records (farmer identity, plot co-ordinates, delivery weights) that most mandis and many processors do not currently keep. Nothing about it is technically difficult; it is a data discipline that has never had a commercial reason to exist. From December it has one.
The carbon claim needs numbers, and numbers need a common methodology. The Indore assessment shows what one company can establish; what the sector lacks is enough comparable studies, on a shared allocation basis and system boundary, to support an origin-level claim rather than a company-level one. Individual footprints conducted to different conventions cannot be aggregated, and a European buyer will not accept an average of incompatible studies. Agreeing that common protocol before the studies proliferate, covering allocation method, treatment of land-use change and background database, is precisely the sort of pre-competitive work an association exists to coordinate, and it costs a fraction of a single season's premium across the industry's export book.
And segregation has to be deliberate. If certified traceable volumes are commingled with undocumented ones at any point between the mandi and the vessel, the premium is lost for the whole parcel, because the EUDR obligation is per plot, and one untraceable plot voids a consignment. That is a physical and procedural commitment, not a marketing decision.
The cost of not doing this is already visible. India's oilmeal exports fell to 37.68 lakh tonnes in FY26 from 43.42 lakh tonnes, and earnings fell considerably faster, to Rs. 9,340 crore from Rs. 12,171 crore, roughly 23% down. Indian meal moves when Argentina and Brazil are constrained, not as a first choice, because as an undifferentiated commodity it cannot win on freight or scale. Differentiation is the only exit from that position, and the market is now handing the industry a differentiator it did not have to create.[13]
6. Yield improves the carbon number and the margin together
One intervention sits on both sides of this argument. Indian soybean yields roughly 950-1,100 kg per hectare against a world average near 2,575 kg, closer to 40% of the global norm than the 60% often quoted, because the comparison is usually made against a world average two decades out of date. Only about 5% of the crop is irrigated, and oil content is around 20%.[14]
Agronomic work suggests 1,500-2,000 kg per hectare is reachable with certified seed, balanced nutrition including sulphur and zinc, and better water management. The commercial case for that is familiar. The carbon case is less discussed and equally strong: field emissions are largely fixed per hectare, so raising output per hectare lowers emissions per tonne almost proportionally. A crop yielding 1,600 kg carries roughly a third less carbon per tonne than the same field yielding 1,050, before any change in practice.
This is the rare intervention with no trade-off to manage. It raises farmer income, improves crush availability, reduces the country's import bill, and strengthens the very number the industry would be taking to European buyers. It should not require a sustainability argument to justify it, but it now has one.
Indian soybean: the position being sold[15]
- Soybean crop: ~105.4 lakh t (2025-26E)
- Total availability: ~110.0 lakh t (2025-26E)
- Area: ~11.2 mn ha (~5% irrigated)
- Yield: ~950-1,100 kg/ha (world average ~2,575)
- Oil content: ~20%
- Madhya Pradesh + Maharashtra share of output: ~86%
- Oilmeal exports: 37.68 lakh t (₹9,340 cr), FY26
- Carbon footprint, regional proxy: ~1.0 t CO₂e / t beans (Latin American comparator ~4.8)
- Measured PCF, refined oil (Indore): 2.74 kg CO₂e / kg, of which 83% at the agricultural stage (TRST01, ISO 14044)
- Water consumption, refined oil: 153.08 m³ / MT (TRST01, ISO 14044)
- GM cultivation: not approved; the crop is non-GM
7. What it will take
- Measure, on primary data, to a recognised standard. The Indore assessment shows it is achievable and that the resulting figure of 2.74 kg CO₂e per kg of packaged refined oil is materially better than the global default the industry is currently judged against. Without a number of your own, that default is what a buyer applies.
- Agree a common protocol before the studies multiply. Allocation method, treatment of land-use change and background database must be shared across firms, or the individual footprints cannot be aggregated into an origin claim and a European buyer will discount all of them.
- Direct decarbonisation spending upstream. Agriculture is 83% of the product footprint and the entire plant under 9%. Field practice, fertiliser efficiency and yield move the number; plant retrofits barely touch it.
- Build plot-level procurement records now. EUDR applies from 30 December 2026. Farmer identity, plot co-ordinates and delivery weights, captured digitally at the point of purchase. The obligation is per plot, and one untraceable plot voids a consignment.
- Commit to segregation, physically. A premium chain that commingles at any point is not a premium chain. Decide which lines, which plants and which lots before the season, not after the enquiry.
- Market non-GM and low-carbon together, not separately. India is one of very few origins that can offer both without an identity-preservation cost. Sold as a single specification they are worth more than the sum of two claims.
- Fix the allocation basis before the price. The same tonne has three defensible footprints and the buyer's regulator picks which one applies.
- Fund yield. It lowers carbon per tonne roughly in proportion to the increase in output, and it is the only measure here that improves the farmer's income, the crusher's availability and the sustainability claim simultaneously.
- Argue origin, not species. Where the crop grew explains more of the carbon number than what crop it is, a fact that condemns Latin American soy, exonerates palm on mineral soil, and favours India.
The sector has spent a long time competing on a basis where it cannot win. Argentina and Brazil will always have more scale and shorter freight, and no amount of efficiency closes that gap. What they increasingly cannot offer is a bean grown on land nobody cleared, without genetic modification, and with a carbon number to prove it. That is a defensible position rather than a marketing line, but only from the moment somebody writes it down.
At TRST01 we help processors and exporters do exactly that: product carbon footprints to ISO 14044, and plot-level EUDR traceability from farmer to vessel. Learn more at trst01.com.
Subscribe to the TRST01 Weekly Newsletter on Traceability for a plain language update every week on the rules and risks shaping global trade.
Notes
[1] In practice the operator files a Due Diligence Statement in the EU Information System for every consignment, carrying the geolocation of every plot that contributed to it and the date or date range of production. The obligation is per plot, not per farm or per lot, so a single untraceable plot makes the whole consignment non-compliant. The operator must also hold documentary evidence of legal production under the origin country's land-use, labour, tax and trade law, complete a risk assessment and, where risk is not negligible, apply risk mitigation before placing goods on the market. Records must be kept for five years. Simplified due diligence is available to micro and small primary operators in low-risk countries, but the geolocation obligation is not waived and does not extend to downstream operators or traders. Penalties reach 4% of EU-wide turnover.
[2] Delegated regulation adopted 10 April 2026, reported in USDA FAS GAIN E42026-0037; the act entered a two-month scrutiny period before the European Parliament and Council, extendable by a further two months, and should not be treated as settled law until that closes. The reclassification followed a methodological change: moving the baseline year from 2008 to 2014 took soy's measured expansion into high-carbon-stock land from roughly 8% to 14.1%, past the 10% threshold. Moratorium timeline: CADE ruling of September/October 2025; Abiove member exit announced 6 January 2026; Brazilian Supreme Court split ruling of 12 August 2026, antitrust probe closed 21 August.
[3] Sharma, M. & Villoria, N.B., European Review of Agricultural Economics, DOI 10.1093/erae/jbag008, modelling EUDR compliance as a trade cost of about 6% ad valorem; the model identifies China and other Asian markets as absorbing destinations and does not model India separately. EU import forecasts from USDA FAS GAIN E42026-0029.
[4] CE Delft, Food Commodity Footprints, commissioned by Oxfam America, 2015 (Figure 22, p.36), per tonne of soybeans, cradle-to-gate, without oil/meal allocation. India falls within the study's 'Asia and Oceania' regional average; no India-specific figure is published, so this is a regional proxy and should be cited as such rather than as a measured national value. For calibration, an ISO-conformant US study puts American soybeans at 341 kg CO₂e per tonne excluding land-use change.
[5] CE Delft (2015) for Oxfam America, per tonne of soybeans, without oil/meal allocation. Regional averages; the study does not disaggregate Brazil from Argentina and publishes no India-specific value. The land-use share is stated in the source for Latin America only.
[6] Directive (EU) 2018/2001, Annex V Part D and Annex VIII Part A. The 55 g factor applies to all oil crops as a group (soy, rapeseed, sunflower and palm alike), and there is no soy-specific or origin-specific ILUC value in the Directive, a point frequently misreported. California value from CARB's Tier 2 pathway report for soybean-oil renewable diesel, a 2017-vintage facility-specific pathway. The US change follows the removal of indirect land-use change from the 45Z credit calculation for fuel produced after 31 December 2025.
[7] Alcock, Salt, Wilson & Ramsden (2022), Science of the Total Environment 829:154539; economic allocation, per kg refined oil, median values. Peat and mineral figures are the land-use emissions component only, not totals. Oil yields per hectare from FAO 2023 data: oil palm 3.04, sunflower 0.76, rapeseed 0.73, soybean 0.44 tonnes of oil per hectare, a metric that assigns the whole hectare to the oil and therefore flatters palm, since soy's dominant product by mass is meal.
[8] Alcock et al. (2022), median values; the palm land-use rows are the land-use emissions component only and are not comparable with the totals. Oil yields are FAO 2023 world averages.
[9] Product Carbon Footprint of Refined Soybean Oil, TRST01. Life-cycle assessment conducted in accordance with ISO 14044:2006; declared unit 1 MT of packaged refined soybean oil; cradle-to-gate system boundary, therefore excluding downstream distribution, consumer use and end-of-life. The processing company is not named here at its own preference; the study also reports water consumption, land use, fossil and mineral resource scarcity, acidification, eutrophication, particulate and ozone formation, ecotoxicity, human toxicity, stratospheric ozone depletion and ionising radiation.
[10] TRST01 independent assessment for an Indore-based processing company; ISO 14044:2006, cradle-to-gate, declared unit 1 MT of packaged refined soybean oil. Shares calculated from the reported stage values. Excludes downstream distribution, use and end-of-life.
[11] Important methodological caveat before this comparison is used commercially: the summary reviewed here does not state the allocation method applied between oil and meal, and Section 3 shows that choice moves the oil's footprint by nearly a factor of two. The Alcock et al. (2022) median of 4.25 is on economic allocation. A like-for-like comparison requires the two studies to share an allocation basis, and any buyer's sustainability team will ask. The allocation method, the treatment of land-use change and the background database should all be stated alongside the headline figure whenever it is quoted.
[12] Study conducted by the Research Institute of Organic Agriculture (FiBL) Austria for AdamPolSoya, primary data collected between August 2022 and February 2023, published via Donau Soja. The comparison baseline is the average imported meal available in Europe, not a specific competing origin.
[13] FY26 oilmeal export data from GLOBOIL Intelligence. China remained the largest destination at 8.78 lakh tonnes, with South Korea at 3.5 lakh tonnes. The FY26 decline reflects Red Sea freight routing on roughly a third of shipments and South American price competition; a crop about 16% smaller than the previous season became the decisive factor from the following quarter.
[14] SOPA world soybean productivity table, 2025-26. SOPA and USDA put Indian yield at 940-983 kg/ha; DES estimates run higher, which is the source of the widely quoted 1,000-1,200 kg/ha range. Irrigation share and oil content from National Academy of Agricultural Sciences, Strategy Paper No. 4. The 2025-26 crop is estimated at about 105.4 lakh tonnes against 125.8 lakh the previous season.
[15] Sources: SOPA (crop, availability, area, yield), NAAS (irrigation, oil content), GLOBOIL Intelligence (oilmeal exports) and CE Delft (regional carbon proxy). The carbon figures are regional averages, not measured Indian values; establishing the latter is the recommendation of this article.
Sources
- TRST01, Product Carbon Footprint of Refined Soybean Oil: independent cradle-to-gate life-cycle assessment under ISO 14044:2006 for a soybean processing company operating from Indore.
- CE Delft for Oxfam America (2015): Food Commodity Footprints: regional GHG footprints for soybeans.
- Sustainable Solutions Corp. for NOPA / United Soybean Board (January 2024): Life Cycle Assessment of U.S. Soybeans, Soybean Meal, and Soy Oil.
- Alcock, Salt, Wilson & Ramsden (2022), Science of the Total Environment 829:154539: harmonised comparative LCA of vegetable oils; FAO oil yield data via Our World in Data.
- FiBL Austria for AdamPolSoya, via Donau Soja: carbon footprint of certified non-GM Ukrainian soybean meal.
- European Commission / Preferred by Nature: EU Deforestation Regulation application dates and due diligence requirements.
- European Commission delegated regulation of 10 April 2026 on high-ILUC feedstocks, as reported in USDA FAS GAIN E42026-0037; USDA FAS GAIN E42026-0029 (EU Oilseeds and Products Annual).
- Sharma & Villoria, European Review of Agricultural Economics: gravity-model analysis of EUDR's effect on global soy trade.
- CADE, Brazilian Supreme Court and Abiove statements: Amazon Soy Moratorium suspension, trader withdrawal and August 2026 ruling.
- Directive (EU) 2018/2001, Annex V and Annex VIII: default carbon intensities, allocation rules and ILUC factors; California Air Resources Board LCFS Tier 2 pathway report.
- Soybean Processors Association of India: crop, availability, area, yield and world productivity data, 2025-26.
- National Academy of Agricultural Sciences: soybean productivity in India.
- GLOBOIL Intelligence: India oilmeal exports FY26, destinations and competitiveness.